Drawing and Interpreting Picture and Bar Graphs
3rd Grade • 1 Lesson Plan Click image to enlarge
and view more
Quick Facts
Subject: Math, Measurement and Data
Type: 1 Lesson Plan
Skills:
Materials Needed:
Printable Resources:
CCSS: 3.MD.B.3, MP5, SL.3.6
Lesson Plan Description
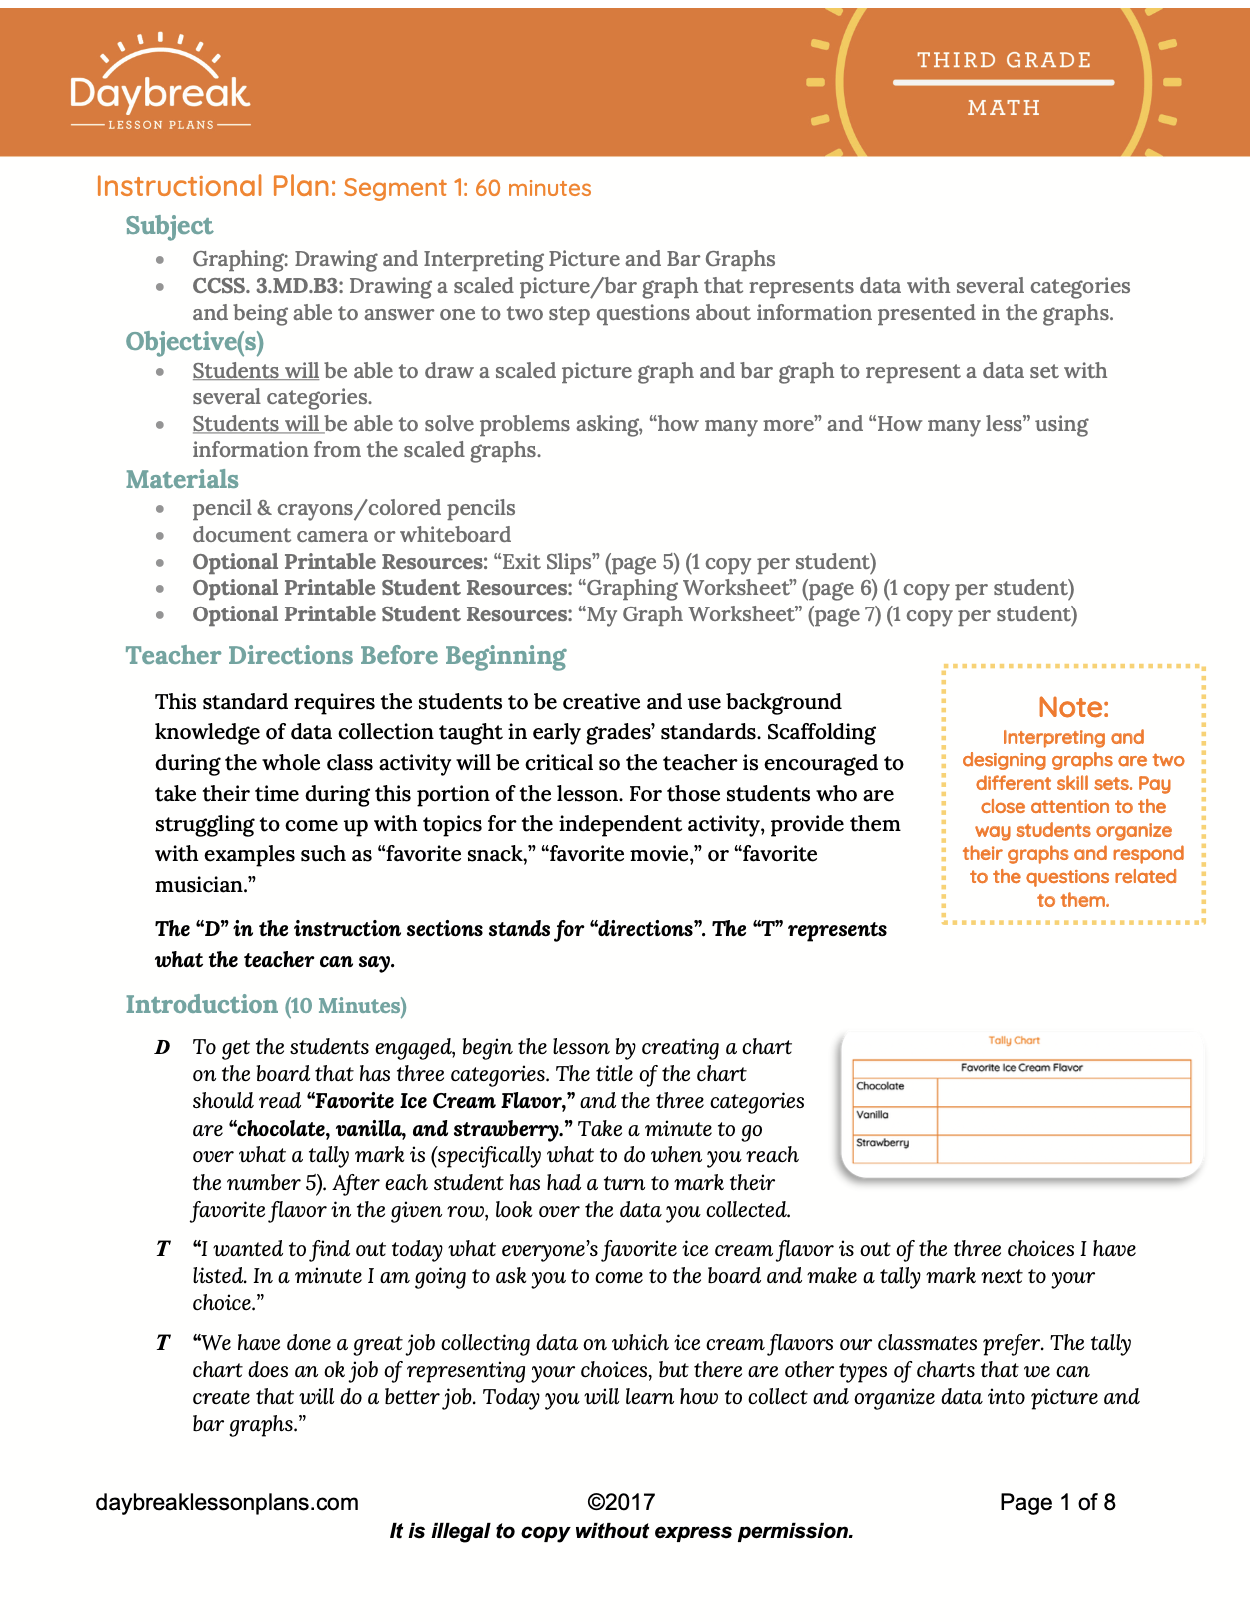
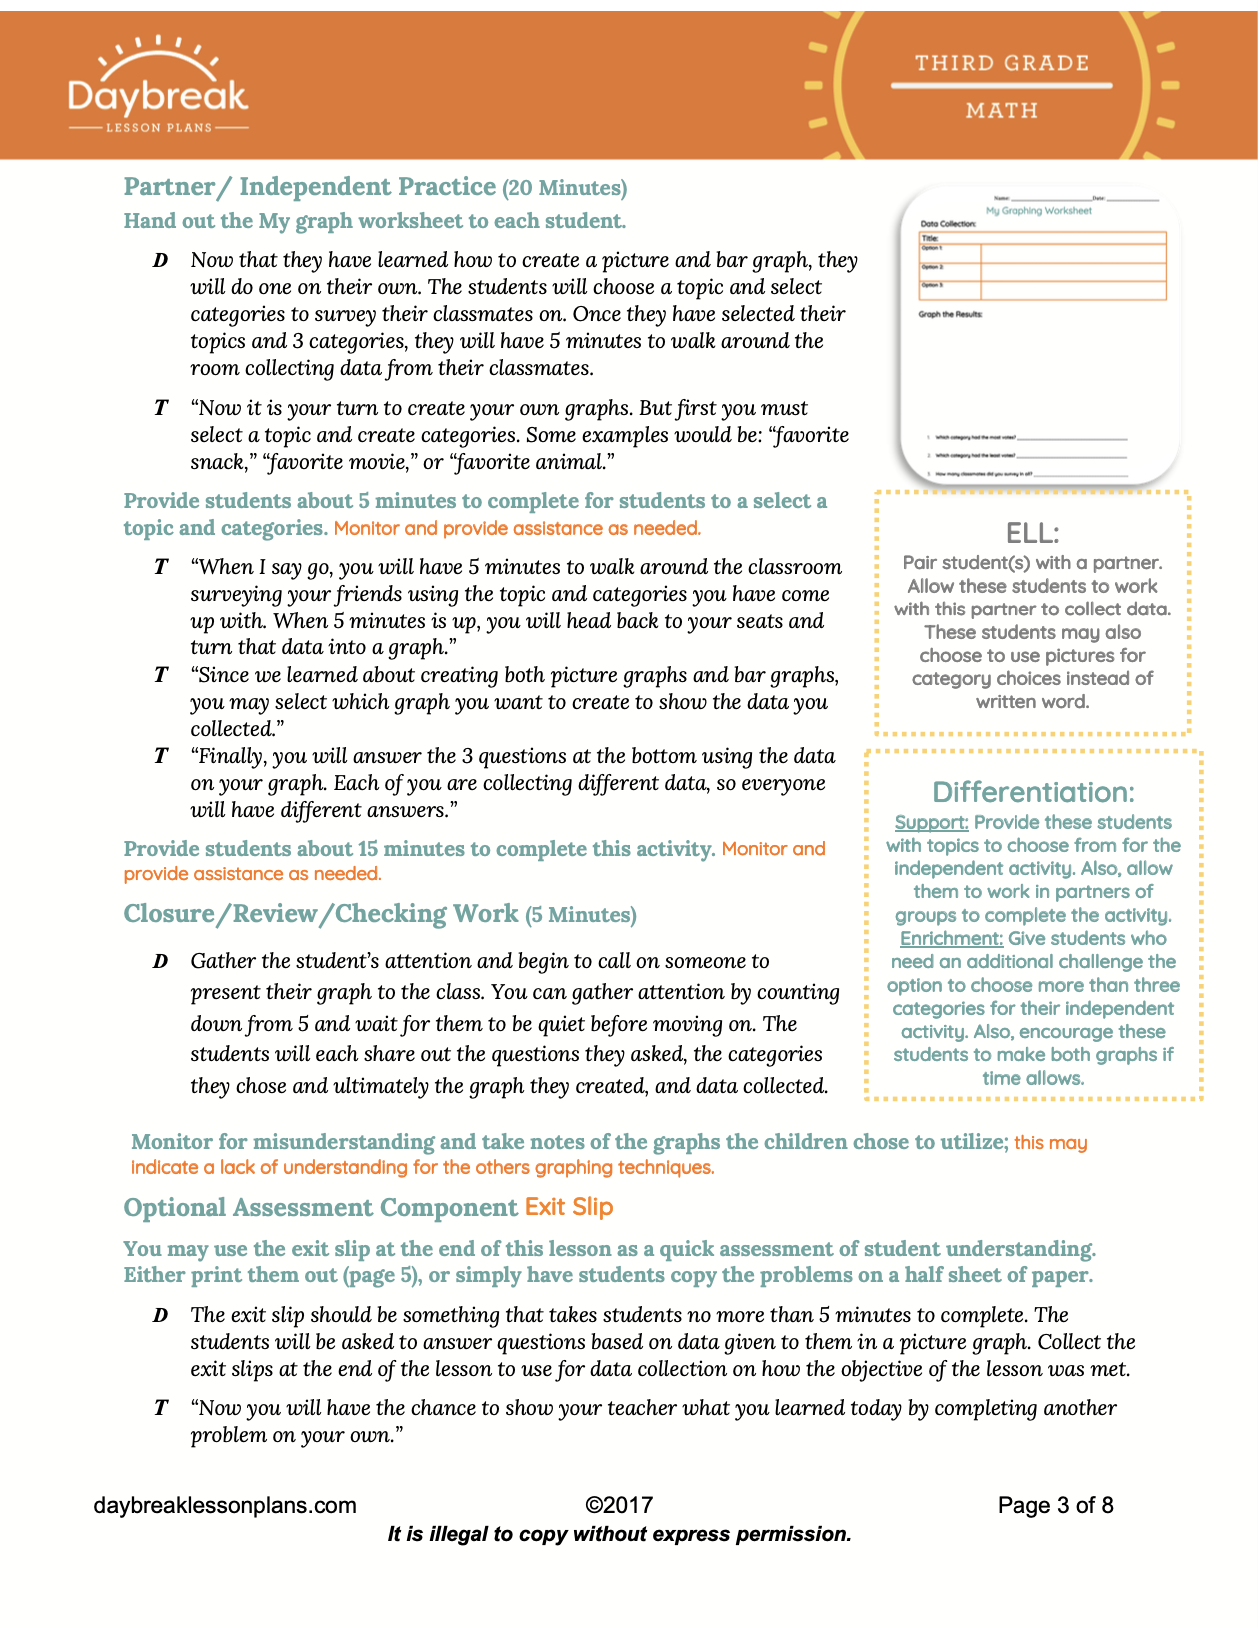
Do your students need more practice with graphing? Bring it to real world application with this engaging lesson that provides multiple access points for all your students to visual data graphically. Your 3rd graders will:
- Work in collaborative partnerships
- Practice key math vocabulary
- Draw and interpret picture and bar graphs
- Generate their own graphs based on topics of interest
- Critically think and explain the “why” of the graphing data
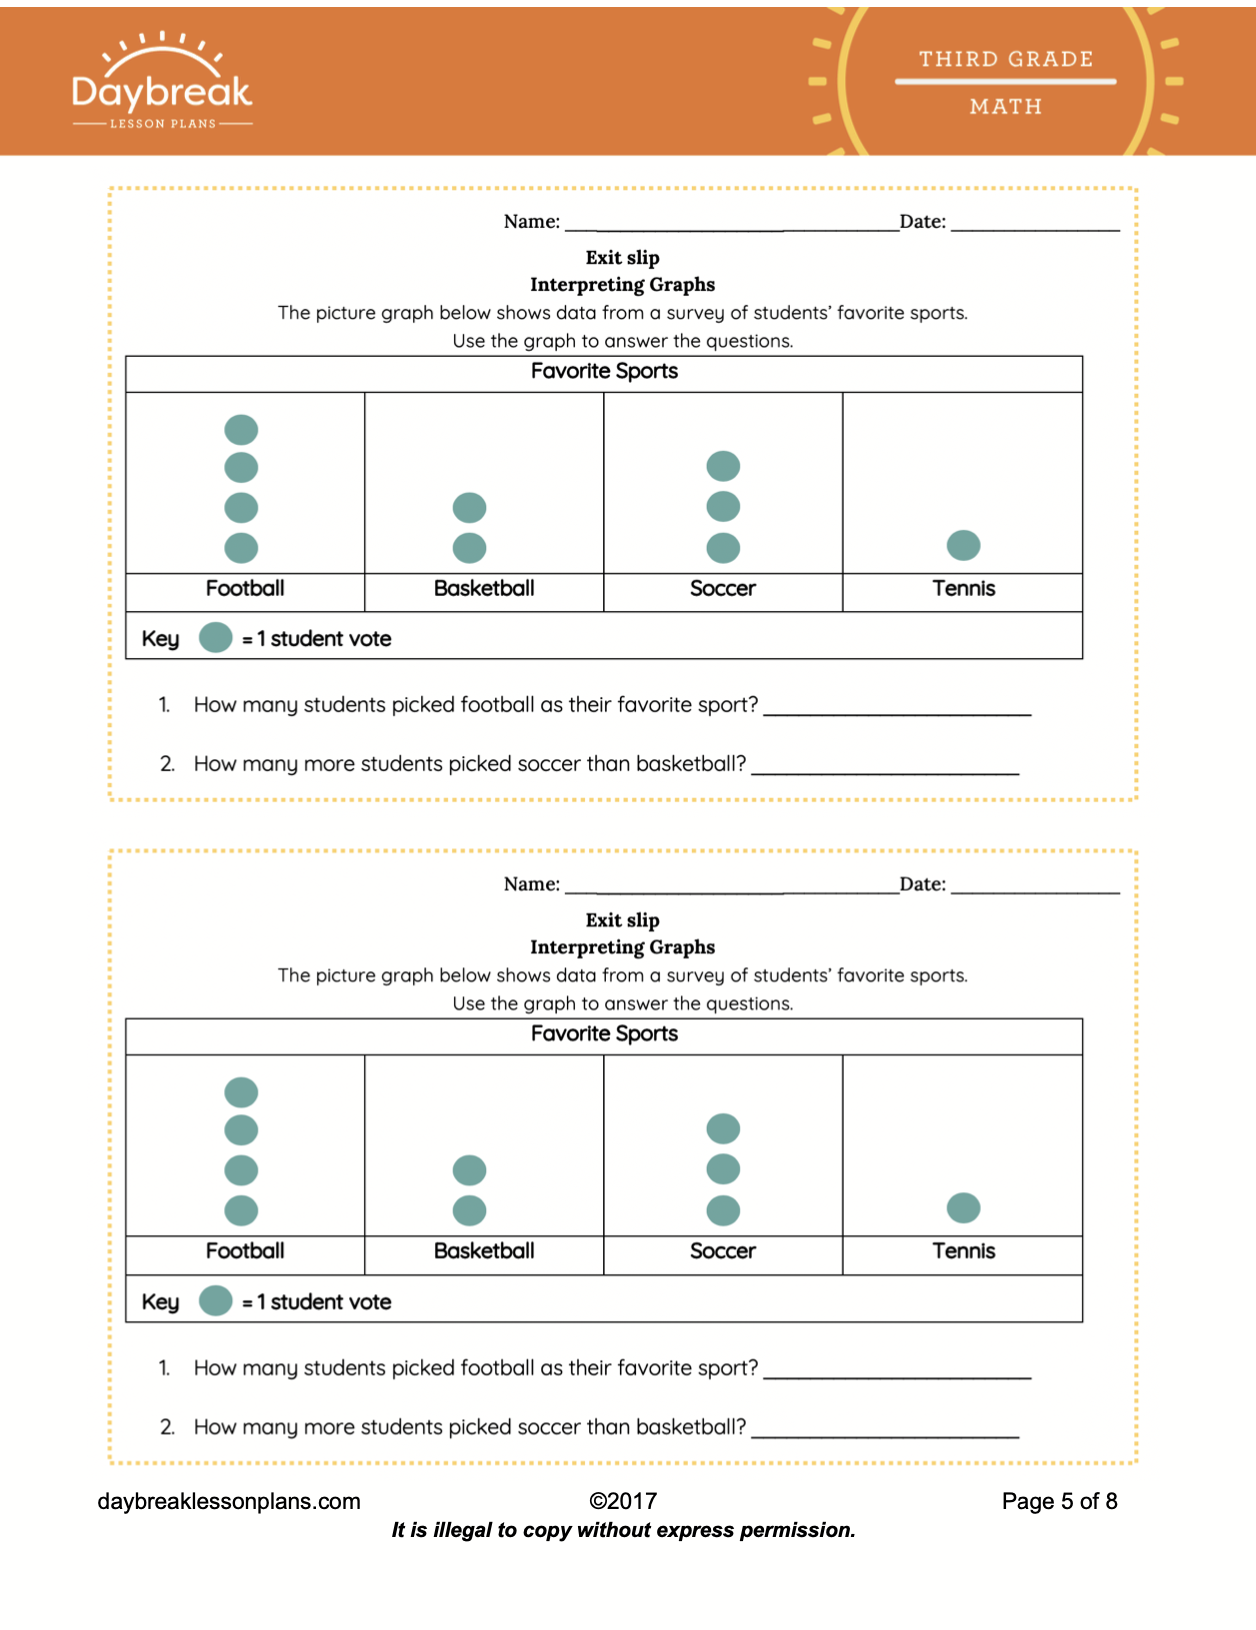
- Complete exit slips to provide instructional next steps